Tag: text mining

  • Digging into the British Empire with R: Lexical topics, part 5

    Some of the most powerful (and interesting) features of working with R on corpus analysis involve exploring technical features of texts. In this script, I use a some well-known R packages for text analysis like tidyr and tidytext, combined with ggplot2, which I used in the previous post, to analyze and visualize textual data.

    This comnbination allows us to do things like find word frequences in particular subsets of the corpus. In this case, I’ve selected for Rudyard Kipling and charted the 10 words he uses most frequently in the corpus:

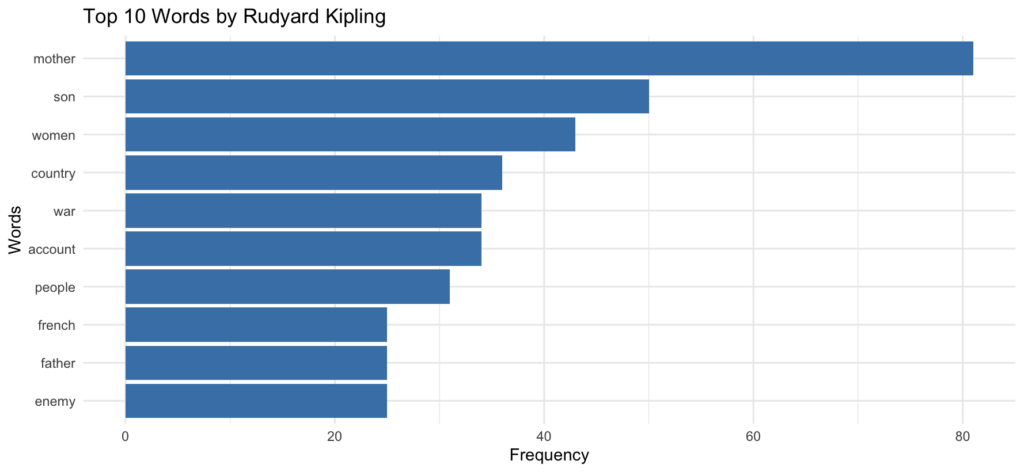
    To accomplish this, I filtered for texts by Kipling, unnested the tokens, generated a word count, and plotted the words in a bar graph. Here’s the code:

    # Filter for a specific author in the corpus and tokenize text into words. Here
    # I've used Kipling 
    word_freq <- empire_texts %>%
      filter(author == "Kipling, Rudyard") %>%
      unnest_tokens(word, text) %>%
      # Remove stop words and non-alphabetic characters
      anti_join(stop_words, by = "word") %>%
      filter(str_detect(word, "^[a-z]+$")) %>%
      # Count word frequencies
      count(word, sort = TRUE) %>%
      top_n(10, n)
    
    # Create bar graph
    ggplot(word_freq, aes(x = reorder(word, n), y = n)) +
      geom_bar(stat = "identity", fill = "steelblue") +
      coord_flip() +
      labs(title = "Top 10 Words by Rudyard Kipling",
           x = "Words", y = "Frequency") +
      theme_minimal()

    I also selected the top 10 bigrams and filtered for author, in this case H. Rider Haggard:

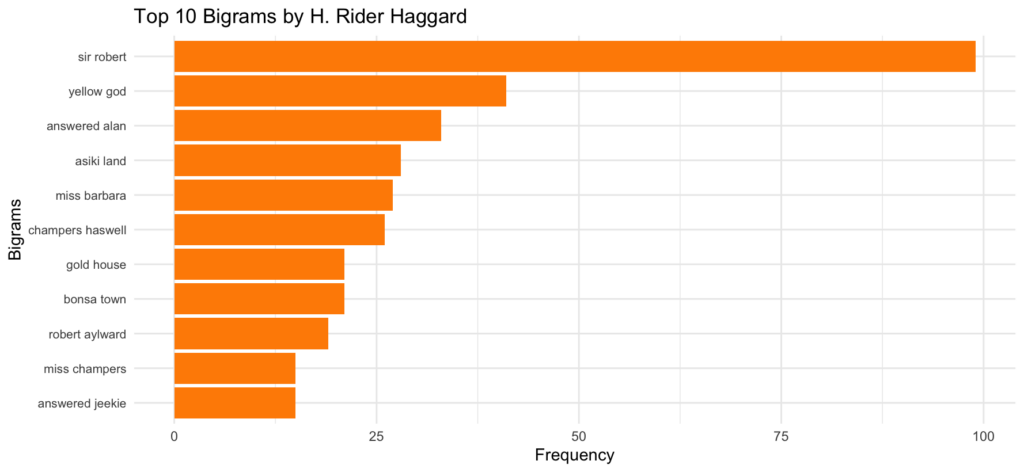
    In this case, I was just interested in seeing any bigrams, but depending on your analysis, you might want to see, for example, what the first word in a bigram is if the second word is always “land.” You could do that by slightly modifying the script and including a line to filter word2 as land. For example:

    bigram_freq <- empire_texts %>%
      filter(author == "Haggard, H. Rider (Henry Rider)") %>%
      unnest_tokens(bigram, text, token = "ngrams", n = 2) %>%
      filter(!is.na(bigram)) %>%
      separate(bigram, into = c("word1", "word2"), sep = " ") %>%
      # Filter for bigrams where word2 is "land"
      filter(word2 == "land") %>%
      filter(!word1 %in% stop_words$word) %>%
      unite(bigram, word1, word2, sep = " ") %>%
      count(bigram, sort = TRUE) %>%
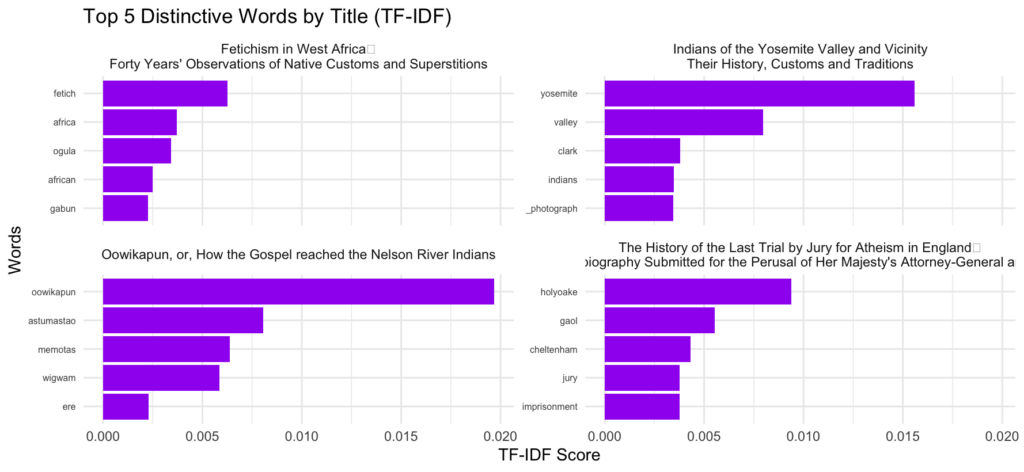
      top_n(10, n)

    Finally, I’ve used TF-IDF (Term Frequency-Inverse Document Frequency) to chart the top 5 most distinctive words by title. The titles are randomly generated from the corpus with set seed (which I’ve set to 279 in my script), but you could regenerate with random titles by changing the set seed number.

    Here’s the script for that:

    # Filter, tokenize, and calculate TF-IDF
    tfidf_data <- empire_texts %>%
      filter(title %in% sample_titles) %>%
      unnest_tokens(word, text) %>%
      anti_join(stop_words, by = "word") %>%
      count(title, word, name = "n") %>%
      bind_tf_idf(word, title, n) %>%
      # Get top 5 words per title by TF-IDF
      group_by(title) %>%
      slice_max(order_by = tf_idf, n = 5, with_ties = FALSE) %>%
      ungroup()
    
    # Create faceted bar plot
    ggplot(tfidf_data, aes(x = reorder_within(word, tf_idf, title), y = tf_idf)) +
      geom_bar(stat = "identity", fill = "purple") +
      facet_wrap(~title, scales = "free_y") +
      coord_flip() +
      scale_x_reordered() +
      labs(title = "Top 5 Distinctive Words by Title (TF-IDF)",
           x = "Words", y = "TF-IDF Score") +
      theme_minimal() +
      theme(axis.text.y = element_text(size = 6))

    Needless to say, you could run this with as many titles as you chose, though the graph gets a little wonky if you run too many–and the process can slow down considerably depending on the size of the corpus.

    It’s worth noting that these plots can be written to an R document called Quarto and published on the web (with a free account) via RPubs. This can help if want to use charts for a presentation, or even if you just want the chart to display online in a more versatile environment. Maybe I’ll write a series on creating presentations in RStudio at some point.

    Here’s the third and final script for our British Empire sentiment analysis.

    Stay tuned for the next project.

  • Digging into the British Empire with R: Loading a corpus, part 3

    Alright, here’s the R script I used to generate the corpus. As you can see, there are a lot of ways this could be tweaked. I didn’t do this, but it would be possible (and probably even preferable) to run the search, collect the data, and manually sift through the results if you have a relatively small corpus.

    # Install packages  
    install.packages("gutenbergr")
    install.packages("dplyr")
    install.packages("stringr")
    
    # Load required libraries
    library(gutenbergr)
    library(dplyr)
    library(stringr)
    
    # Get the Gutenberg metadata
    gb_metadata <- gutenberg_works()
    
    # Define search terms related to British Empire
    search_terms <- c("india", "colony", "colonial", "empire", "africa", "asia", 
                      "imperial", "natives", "british", "england", "victoria", 
                      "trade", "east india", "conquest")
    
    # First approach: Find works with publication dates in the 19th century where possible
    # Many Gutenberg works have no publication dates
    dated_works <- gb_metadata %>%
      filter(
        language == "en",
        !is.na(gutenberg_author_id),
        !str_detect(title, "Bible|Dictionary|Encyclopedia|Manual|Cookbook")
      ) %>%
      # But some do, so let's make sure we get those 
      filter(
        !is.na(gutenberg_bookshelf),
        str_detect(gutenberg_bookshelf, "1800|19th")
      )
    
    # Second approach: Find popular authors from the 19th century
    empire_authors <- c("Rudyard Kipling", "Joseph Conrad", "Charles Dickens", 
                        "H. Rider Haggard", "Robert Louis Stevenson", "Anthony Trollope", 
                        "E.M. Forster", "John Stuart Mill", "Thomas Macaulay", 
                        "Thomas Babington Macaulay", "James Mill", "George Curzon",
                        "Frederick Lugard", "Richard Burton", "David Livingstone",
                        "Henry Morton Stanley", "Mary Kingsley", "Flora Annie Steel")
    
    author_works <- gb_metadata %>%
      filter(
        language == "en",
        str_detect(author, paste(empire_authors, collapse = "|"))
      )
    
    # Third approach: Keyword search in titles
    keyword_works <- gb_metadata %>%
      filter(
        language == "en",
        str_detect(tolower(title), paste(search_terms, collapse = "|"))
      )
    
    # Combine all of the above approaches into one dataset
    empire_works <- bind_rows(dated_works, author_works, keyword_works) %>% 
      distinct() %>%
      # Use author birth/death dates to try and estimate 19th century works
      left_join(gutenberg_authors, by = "gutenberg_author_id") %>%
      filter(
        # Authors who lived during the 19th century (possibly born earlier)
        (is.na(birthdate) | 
           birthdate <= 1880) & # Born before or during most of the 19th century
          (is.na(deathdate) | 
             deathdate >= 1800)   # Died after the 19th century began
      )
    
    # View how many books we found
    print(paste("Found", nrow(empire_works), "potentially relevant works"))
    
    # Preview the first few works
    head(empire_works %>% select(gutenberg_id, title, author.x), 20)
    
    # If we have more than 1000 works, we can limit to the most relevant
    # I'm going to cap this at 1000 works, but feel freee to use a lower number if you prefer
    if(nrow(empire_works) > 1000) {
      # Calculate a relevance score based on how many search terms appear in the title
      empire_works <- empire_works %>%
        mutate(
          relevance_score = sapply(title, function(t) {
            sum(sapply(search_terms, function(term) {
              if(str_detect(tolower(t), term)) 1 else 0
            }))
          })
        ) %>%
        arrange(desc(relevance_score)) %>%
        head(1000)
    }
    
    # Download the corpus (this will take time)
    # Uncomment the two lines below when ready to download
    empire_texts <- gutenberg_download(empire_works$gutenberg_id, 
                                     meta_fields = c("title", "author"))
    
    # Take a quick look at the dataset to get a sense of how it's organized  
    View(empire_texts) 
    
    # You might want to save the metadata for future reference. If so, uncomment
    # the following lines 
    
    #write.csv(empire_works %>% select(gutenberg_id, title, author.x), 
    #          "outputs/empire_corpus_metadata.csv", row.names = FALSE)
    
    
  • Digging into the British Empire with R: Swapping out HTRC for Gutenbergr, part 2

    In the last post, I detailed the process for building a corpus using HTRC’s Extracted Features datasets. In this post, I’m going to explain a little bit about what Extracted Features are, whether or not they might be useful for a text mining project, the problems I had working with them, why I decided to use Project Gutenberg instead, and how to go about using HathiTrust instead of Gutenberg if that’s your preference.

    Let’s start with the Extracted Features dataset.

    Each volume in our collection list has a page-level JSON file with features for that page–these features include metadata about the volume and metadata about the page, including a word frequency list.

    So what can you do with this dataset?

    Well, you can track things like word frequency across sections for each book. With multiple books, you could track word frequency over decades. Using keywords in titles, you could track topics in publication data across decades (or centuries). If you’re interested in the history of the book or publishing, you could track that information across a large corpus. You could do a sentiment analysis with this data, though since the page-level metadata is only giving you keyword frequency, working with a full-text corpus would be preferable.

    The takeaway is this: using HTRC lets you text mine bibliographic metadata; Extracted Features do not really enable you to build a corpus.

    Additionally, I ran into several challenges using the HTRC Extracted Features data. I have not found many examples on the web or in publications of people performing research using these datasets, but it’s possible I’ve overlooked them. These are the problems I had, but your mileage may vary.

    1. The JSON parsing is extremely difficult
      • At first, I assumed this was because of the size of my dataset (800 volumes at the beginning). I cut this in half twice, finally using just a couple hundred volumes. It was still nightmarishly slow. For some specs, I started by trying to parse the files on my local computer (M4 Mac, 16GB RAM), which generally performs data analyses well. When parsing kept stalling out, I switched over to RStudio Cloud Posit Cloud, used the paid version, maxed out the specs, and tried to parse overnight. Nothing doing
      • After repeat failures, I did some digging into the dataset. Each JSON file in the dataset requires, on average, 1,050 “gathers” from the parser. At 1,050 gathers per 800 files, we’re closing in at 850,000 processes (these are averages, of course). If we assume ~1.5KB per gather for only the metadata, we’re looking at 1.26GB for processing metadata. So far, not bad. But some of the Extracted Features files are ~5MB: at 1,000 files, we’re inching up on 4-5GB of memory, assuming some of the Extracted Feature files are ~5MB. Significant, but not so bad
      • To list these parsed elements, R loads all files in the corpus in memory all at once. Most people assume 3x overhead for R processes, so for 4-5GB in memory, the overhead is 12-15GB, maxing out the 16GB Mac (which, of course, still has to run its own processes)
      • To make matters worse, we also need to run bind_rows() to flatten the JSON file into a data frame. Again, R holds the original in memory while copying, putting us at 24-30GB of RAM. Finally, the more nested the structure the more memory–and here’s the kicker–even when deleting the biggest JSON files in the corpus, even when cutting the corpus to around 150 volumes and then subsetting the data I was trying to parse, I was unable to run anything substantive without maxing out memory, even when using up to 32GB of RAM in a cloud environment, even when using Parallels to divide up my cores, etc.
    2. Metadata vs. full-text: Is the juice worth the squeeze?
      • At some point, I decided it was time to move on–the whole reason I wanted to use the Extracted Features dataset in the first place was so that I could analyze a huge corpus since I was relying on metadata and not full-text. In fact, the only reason I downloaded 800-1000 texts was for a quick example of what could be done; my hope was to eventually start a project where I could analyze 5 or 10x that number
      • Ultimately, if I have to significantly cut down the corpus size and pare down the metadata by subsetting just to analyze a couple hundred texts, I might as well actually analyze them in full-text. I’m not sure why the dataset’s JSON structure is so overwrought, but it seems to me that the point of using a dataset like this would be to process a corpus orders of magnitude larger than you could with full-text. Since that did not turn out to be the case for me, I decided to abandon the dataset for a full-text option

    I will point out that I emailed HathiTrust to ask whether or not it is possible to bulk download text files for out-of-copyright work, and it is possible by submitting some paperwork to them. I am going to take them up on that for another project in the future, but for now I’m going to Project Gutenberg for the sentiment analysis on the British Empire.

    Project Gutenberg is not without its own challenges–first of all, the library itself is not as professionally curated as HathiTrust’s, which derives its catalog data from contributing academic institutions. Second, there’s just not as much there. And finally (I did not realize this until working with the data!), there is no publication date in Project Gutenberg metadata. I’m not sure why this is the case–it’s certainly something that people complain about. So to work on any kind of chronological analysis, you’d need to either 1) supply the dates manually or 2) include relative dates (e.g., second half of the nineteenth century) based on author birth/death dates, which are in the database. Obviously neither is ideal, but with a small enough corpus, option 1 is probably the best bet.

    Another strength of Project Gutenberg is that a corpus can be built simply using the gutenbergr R package–even a corpus of 1-2000 texts can be built easily in under an hour.

  • Digging into the British Empire with R and HathiTrust, step 1

    I had anticipated a more exciting update on this endeavor today, but I ran into a few problems getting the corpus from HathiTrust. In case anyone uses this as a guide for building a digital corpus, I’m going to document the steps I took.

    The HTRC documentation is scattered across GitHub, Atlassian, the HTRC website, the HathiTrust website, and the HTRC analytics subdomain. I couldn’t really make heads or tails of how this documentation works together, and I ran into several frustrating elements across these sites that seem to be outdated.

    I would’ve preferred to use the HathiTrust Data API, but it has evidently been deprecated.

    HathiTrust has a Python library called HTRC Feature Reader—this is exactly what I was looking for (or so I thought). I’m not sure if this tool has been deprecated as well, but the Python library depends on several outdated dependencies. When I started, I figured I’d just update the libraries in question, but that trapped me in dependency hell. I then decided to downgrade Pip and Python in a virtual environment, only to open a new series of dependency problems. Ultimately, I abandoned the Feature Reader too (though, as you’ll see below, you still need to install it because, despite its dependency issues, downloading the library installs an important command-line tool you’ll need later).

    Just for kicks, I also tried this in the recommended Anaconda environment—no dice.

    What I wound up doing was creating a collection in the standard advanced search interface of HathiTrust. I saved just over 1,000 texts with keywords, setting the date range to 1800–1899 and selecting English-language texts. I called the collection “Imperial Sentiments” and made it public. Then, I downloaded the metadata file, which includes the HTID—HathiTrust’s identifier in its metadata.

    Once you download the metadata file as a CSV, copy and paste the volume ID numbers into a separate text file. Delete the column title and name it something simple, like volume_ids.txt.

    If you haven’t already done so by this point, make sure you’ve installed the HTRC Feature Reader—I recommend running pip install htrc-feature-reader in the command line.

    Then, run the following:

    bash

    htid2rsync --from-file volume_ids.txt >> paths.txt

    This will take the list of HTIDs from volume_ids.txt, convert them to the paths you’ll need to download the HathiTrust files, and output those paths into a file called paths.txt.

    Now you’re ready to start downloading!

    To download the Extracted Features files, you’re providing a list of files you want to HathiTrust’s servers, which then check the paths you provide and download the files to the directory you specify. We’ll accomplish this with a protocol called rsync, which is native to macOS and Linux and can be downloaded for Windows.

    Run the following command:

    bash

    rsync -av --no-relative --files-from=paths.txt data.analytics.hathitrust.org::features/ /local/destination/path/

    A couple of things are important to note:

    You’ll definitely want to run this in verbose mode (hence the -av) because the process can hang sometimes, and without verbose output, you won’t know whether it’s just downloading a lot at once or if something’s wrong.

    The compressed JSON files are spread across nested directories on the server—there’s almost no circumstance in which you’d want to keep that nested file structure, so use –no-relative to flatten it.

    Make sure you specify your local path correctly. If you don’t, rsync saves to a temp folder you’ll have to track down.

    After running the script, you should have your corpus!

    Before working with the files, you’ll want to extract them, either in the command line or via a GUI, and then delete the zipped files. It’s probably easiest to navigate to the folder in the command line and run something like rm *.bz2 (but make sure you know what you’re doing).

    And that’s it! Hopefully, I’ve saved someone the pain of wading through outdated documentation or tinkering with Python libraries when this is really a relatively painless and simple process.

    In the next post, we’ll take a look at what exactly these HTRC files are comprised of and determine whether or not they’re fit for different kinds of projects.

  • Digging into the British Empire with R and HathiTrust

    What did nineteenth-century texts say about the British Empire, and how can we use code to figure it out? In the next few posts, I’m going to explore some digital humanities ideas, using R to sift through some nineteenth-century texts from the HathiTrust Digital Library. I’ll look at novels, essays, travelogues, etc. I’ll start with HathiTrust’s Extracted Features dataset, which gives word counts for tons of digitized volumes. I’m aiming for 500–1,000 texts with terms like “colony,” “trade,” or “power,” just to keep it manageable. In R, I’ll use tools like tidytext and dplyr to clean things up—removing stop words—and focus on words tied to the empire. My approach will be simple.

    First, I’ll look at which empire-related words show up most, broken down by decade—maybe “conquest” early, “trade” later? Then, I’ll try sentiment analysis with the NRC lexicon to see if I can detect any tonal shifts in the way empire is discussed. After that, I’ll run topic modeling with LDA to spot patterns—military topics, economic topics, whatever emerges. I’ll use R to visualize this data, making it comprehensible and attractive.

    If you’re into digital humanities, this might spark ideas about blending tech with texts in the public domain. If you like coding, it’s an interesting exercise in working with messy data in R. Stick around!